No Widget Added

Please add some widget in Offcanvs Sidebar

Welcome to Great Chicago Consulting

shape
shape

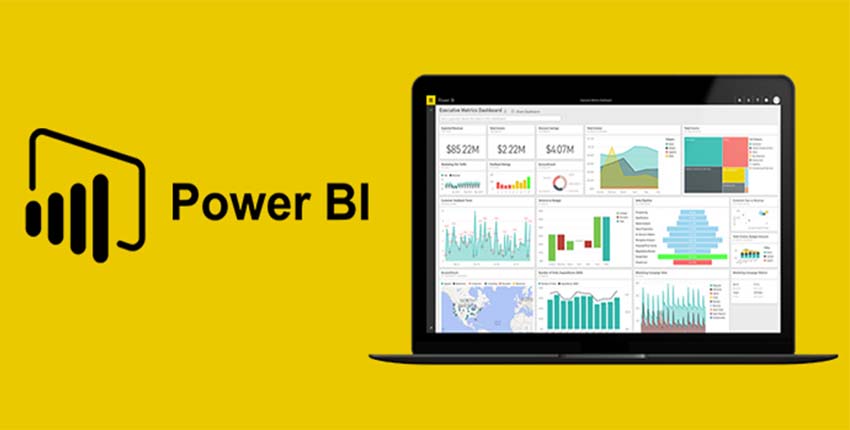
Microsoft Power BI

Students 0 Views 191

Microsoft Power BI

Key Highlights
  • 36 Hrs Instructor Led Training
  • 36 Hrs Self-paced Videos
  • 52 Hrs Projects & Excercises
  • Job Assistance
  • Flexible Schedule
  • Lifetime Free Upgrade
  • Certification
  • Mentor Support

    About The Course

    What will you learn in this Power BI training? 

    As a part of this Power BI course: 

    You will master the technique of creating visually appealing and insightful charts, graphs, and reports by deploying this tool in real business scenarios. 

    Use Salesforce Data, Azure SQL Database, and SQL Server analysis tabular data. 

    You will be working on real-time projects designed by industry experts. 

    Why should you take this online Power BI course certification? 

    By 2025, the market for business intelligence is projected to reach a value of $33.3 billion. Sales, marketing, executive teams, insurance companies, and other business services have all seen a major increase in the use of BI. With the help of this Microsoft Power BI course, you will obtain a competitive advantage in the creation of unique graphics and the delivery of accurate analyses of massive amounts of data. 

    By the end of this online Power BI certification course, you will be proficient enough to implement data analysis in Microsoft Excel and direct connectivity with Microsoft SQL Azure and SQL Server Analysis Services (SSAS). 

    What is the average salary for a Power BI developer? 

    Power BI-certified developers are some of the most paid professionals in the data science domain. The average pay of a Power BI developer in the US is $97,920 per year, according to Glassdoor.

    Course Curriculum: 

    Module 1 – Introduction to Power BI 

    In the first module of this Power BI course, you will learn the basics of Power BI

    • Introduction to business intelligence (BI)
      1.2 Stages of business intelligence (BI)
      1.3 Use cases of BI
      1.4 Various BI tools
      1.5 Overview of data warehouse and concepts
      1.6 Introduction to Power BI
      1.7 Why Power BI?
      1.8 Power BI components
      1.9 Power BI pricing structure
      1.10 Building blocks of Power BI
      1.11 Architecture of Power BI
      1.12 Power BI vs Tableau vs QlikView
      1.13 Introduction to Power BI desktop
      1.14 Installation of Power BI desktop
      1.15 The key features of Power BI workflow
      1.16 Process of creating reports in Power BI 

    Module 2 – Data Extraction 

    In the second module of this Power BI certification, you will learn the basics of data extraction

    • 2.1 Overview of Power BI desktop
      2.2 Data sources in Power BI
      2.3 Using files (excel, pdf, csv, etc.) as a data source
      2.4 Using SaaS connectors
      2.5 Extracting data from folders, and databases
      2.6 Working with Azure SQL database and database sources
      2.7 Connecting to Analysis Services
      2.8 Other data sources (OData, web, SharePoint, etc.)
      2.9 Python R script in Power BI
      2.10 Introduction of power query editor
      2.11 Advance editor
      2.12 Query dependency editor 

    Module 3 – Data Transformation – Shaping and Combining Data 

    • 3.1 Shaping data using Power Query Editor
      3.2 Formatting data
      3.3 Transformation of data
      3.4 Understanding of Data types
      3.5 Data profiling for data quality check
      3.6 Naming conventions and best practices to consider
      3.7 Identify and create appropriate keys for joins
      3.8 Working with Parameters
      3.9 Merge Query
      3.10 Append Query
      3.11 Group by of data (aggregation of data)
      3.12 Applied steps (query settings)
      3.13 Duplicate and reference tables
      3.14 Transpose of data
      3.15 Fill
      3.16 Pivot & Un-pivot of data
      3.17 Custom columns
      3.18 Conditional columns
      3.19 Replace data from the tables
      3.20 Split columns values
      3.21 Move columns and sorting of data
      3.22 Detect data type, count rows, and reverse rows
      3.23 Promote rows as column headers
      3.24 Hierarchies in Power BI
      3.25 M query 


    Module 4 – Data Modelling and DAX 

    • 4.1 Introduction to relationships
      4.2 Creating relationships
      4.3 Cardinality
      4.4 Cross-filter direction
      4.5 Use of inactive relationships
      4.6 Introduction of DAX
      4.7 Why is DAX used?
      4.8 DAX syntax
      4.9 DAX functions
      4.10 Context in DAX
      4.11 Calculated columns using DAX
      4.12 Measures using DAX
      4.13 Calculated tables using DAX
      4.14 Learning about table, information, logical, text, iterator,
      4.15 Time intelligence functions (YTD, QTD, MTD)
      4.16 Cumulative values, calculated tables, and ranking and rank over groups
      4.17 Date and time functions
      4.18 Identify poorly performing measures, relationships, and visuals
      4.19 DAX advanced features 


    Module 5 – Data Visualization with Analytics 

    • 5.1 Deep dive into Power BI data visualization
      5.2 Understanding Power View and Power Map
      5.3 Data visualization techniques
      5.4 Page layout and formatting
      5.5 Power BI Desktop visualization
      5.6 Formatting and customizing visuals
      5.7 Visualization interaction
      5.8 Custom visualization in Power BI
      5.9 Top-down and bottom-up analytics
      5.10 Drill down
      5.11 Drill through
      5.12 Page navigations
      5.13 Bookmarks
      5.14 Selection pane to show/hide visuals
      5.15 Comparing volume and value-based analytics
      5.16 Combinations charts (dual axis charts)
      5.17 Filter pane
      5.18 Slicers
      5.19 Use of Hierarchies in drill down analysis
      5.20 Theme for corporate standards
      5.21 Power BI template for design reusability
      5.22 Mastering the best practices
      5.23 Performance analyzer in Power BI for monitoring performance of report
      5.24 Power BI Q&A (Natural Language Query visual)
      5.25 Sync slicers
      5.26 Tooltips and custom tooltips
      5.27 Tables and matrix
      5.28 Conditional formatting on visuals
      5.29 Waterfall chart, KPI, Donut chart, Scatter chart
      5.30 Geographical data visualization using Maps 


    Module 6 – Power BI Service (Cloud), Q & A, and Data Insights 

    • 6.1 Introduction to Power BI service
      6.2 Introduction of workspaces
      6.3 Dashboard
      6.4 Creating and configuring dashboards
      6.5 Dashboard theme
      6.6 Reports vs Dashboards
      6.7 Building workspace apps
      6.8 Sharing reports and dashboards
      6.9 configure subscriptions and data alerts
      6.10 Paginated report
      6.11 Introduction to Power Q & A
      6.12 Ask questions about your data using natural query language
      6.13 Getting answers in the form of charts, graphs, and data discovery methodologies
      6.14 Configure custom questions for Q&A like FAQ
      6.15 Ad-hoc analytics building
      6.16 Power Q&A best practices
      6.17 Quick Insights
      6.18 Subscribe, alerts, usage statics, related content
      6.19 Design reports on Power BI service
      6.20 Collaboration using Power BI service
      6.21 Row level security (RLS)
      6.22 Introduction of paginated reports
      6.23 Introduction of Power BI report server 


    Module 7 – Power BI Settings, Administration, and Direct Connectivity 

    • 7.1 Understanding Power BI desktop settings
      7.2 Aggregating data from multiple data sources
      7.3 Power BI service settings
      7.4 Power BI admin portal
      7.5 Administration activities
      7.6 Power BI usage analysis
      7.7 Introduction of Office 365 admin activities
      7.8 Introduction of Data Gateway
      7.9 Installation and configuration of data gateways
      7.10 Scheduling auto data refresh
      7.11 Managing groups, row-level security, datasets, reports, and dashboards
      7.12 Real-time data analysis using direct connectivity
      7.13 Direct query vs import mode 


    Module 8 – Embedded Power BI with API and Power BI Mobile 

    • 8.1 Introduction to embedded Power BI
      8.2 Create embedded code
      8.3 Manage embedded code
      8.4 Integration of Power BI in SharePoint
      8.5 Introduction of Power BI API
      8.6 Power BI embedded playground
      8.7 Introduction to Power BI Mobile
      8.8 Creating mobile-based reports and dashboards
      8.9 Optimizing report for Power BI mobile app
      8.10 Features of Power BI mobile app
      8.11 Introduction of integrating Power BI & Excel
      8.12 Power BI Analyze in Excel 


    Module 9 – Power BI Advance and Power BI Premium 

    Coming to the last module of this Power BI certification course, you will learn advanced Power BI and Power BI Premium. 

    • 9.1 Introduction to Power BI Premium
      9.2 Power BI Premium per user
      9.3 Power BI Premium features
      9.4 Introduction to Data Flow
      9.5 Create data flow
      9.6 Advantages of data flow
      9.7 Create reports using data flow
      9.8 Introduction to Power BI deployment pipelines
      9.9 Create deployment pipelines
      9.10 Benefits of deployment pipelines
      9.11 Introduction of sensitivity labels
      9.12 Introduction of Power BI goals feature
      9.13 Incremental data load in Power BI
      9.14 Use AI visuals
      9.15 Use the Forecast feature
      9.16 Power BI best practice rules to improve performance
    Show More
    The Course Curriculam

    Introduction to Power BI

    • Introduction to business intelligence (BI)
      00:00
    • Stages of business intelligence (BI)
      00:00
    • Use cases of BI
      00:00
    • Various BI tools
      00:00
    • Overview of data warehouse and concepts
      00:00
    • Introduction to Power BI
      00:00
    • Why Power BI?
      00:00
    • Power BI components
      00:00
    • Power BI pricing structure
      00:00
    • Building blocks of Power BI
      00:00
    • Architecture of Power BI
      00:00
    • Power BI vs Tableau vs QlikView
      00:00
    • Introduction to Power BI desktop
      00:00
    • Installation of Power BI desktop
      00:00
    • The key features of Power BI workflow
      00:00
    • Process of creating reports in Power BI
      00:00

    Data Extraction

    Data Transformation – Shaping and Combining Data

    Data Modelling and DAX

    Data Visualization with Analytics

    Power BI Service (Cloud), Q & A, and Data Insights

    Power BI Settings, Administration, and Direct Connectivity

    Embedded Power BI with API and Power BI Mobile

    Power BI Advance and Power BI Premium

    c34516ae152f58bc30a2dbffbf2557f0?s=96&d=mm&r=g

    Admin

    8 Courses 15 Students
    No Review Yet
    No Review Yet
    × How can I help you?